Utilities
Table of Contents
Documentation Conventions
Commands and keywords are in this
font.$OFFLOAD_HOMEis set when the environment file (offload.env) is sourced, unless already set, and refers to the directory namedoffloadthat is created when the software is unpacked. This is also referred to as<OFFLOAD_HOME>in sections of this guide where the environment file has not been created/sourced.Third party vendor product names might be aliased or shortened for simplicity. See Third Party Vendor Products for cross-references to full product names and trademarks.
Introduction
In addition to major software components such as Offload, Present and Smart Connector, Gluent Data Platform also includes a number of additional utilities for orchestration and hybrid query monitoring. These are described in this guide, with simple examples and/or instructions to demonstrate their core functionality, and are organized as follows:
Gluent Query Engine Utilities
The following Gluent Query Engine utilities are described below:
Hybrid Query Report
Hybrid Query Report provides an end-to-end view of resource consumption, performance and behavior for a hybrid query. Two interfaces are provided:
A SQL*Plus script
An Oracle SQL Developer report
Both are described below.
Important
Hybrid Query Report utilizes Oracle’s Real Time SQL Monitoring feature, which requires an Oracle Tuning Pack license (which itself requires an Oracle Diagnostic Pack license). Ensure that you are adequately licensed before using this utility.
Privileges Required for Hybrid Query Report
Users wishing to use Hybrid Query Report must be granted the GLUENT_OFFLOAD_SQLMON_ROLE database role. However, users with the broader GLUENT_OFFLOAD_ROLE role will also be able to use this utility (note that the GLUENT_OFFLOAD_ROLE role contains additional privileges, such as access to log files and Gluent Data Platform’s Oracle database directory objects, so it may not always be appropriate for users who need access only to Hybrid Query Report).
Generating a Hybrid Query Report in SQL*Plus
A hybrid query report is generated using the hybrid_query_report.sql script, located in the $OFFLOAD_HOME/sql/hybrid_query_report directory (it can be used from this location on the server or can be copied to any host with a SQL*Plus client):
$ cd $OFFLOAD_HOME/sql/hybrid_query_report
There are five ways to identify the SQL statement to generate the report for:
Report on the Latest Monitored Hybrid SQL for a SID
Identify the SID of the monitored hybrid SQL statement and run the following in SQL*Plus.
SQL> @hybrid_query_report.sql sid=<SID>
Notes:
Hybrid Query Report considers the latest monitored SQL to be the one with the most recent refresh/completion time for the given SID, identified by V$SQL_MONITOR.LAST_REFRESH_TIME. In the event that there are multiple sub-second monitored SQL statements for the session, they are further pruned by finding the one with the most recent V$SQL_MONITOR.SQL_EXEC_START and V$SQL_MONITOR.SQL_EXEC_ID
Only monitored SQL statements containing Gluent Data Platform hybrid objects will be considered
Report on the Latest Monitored SQL for a SQL_ID
Identify the SQL_ID of the monitored SQL statement (V$SQL_MONITOR can be used for this) and run the following in SQL*Plus.
SQL> @hybrid_query_report.sql sql_id=<SQL_ID>
Notes:
Hybrid Query Report considers the latest monitored SQL to be the one with the most recent refresh/completion time for the given SQL_ID, identified by V$SQL_MONITOR.LAST_REFRESH_TIME. In the event that the SQL statement has multiple SQL Monitoring entries with the same last refresh/completion time, they are further pruned by finding the one with the most recent V$SQL_MONITOR.SQL_EXEC_START and V$SQL_MONITOR.SQL_EXEC_ID
This method can also be used to generate reports for non-hybrid SQL statements if required
Report on a Specific Monitored SQL
Identify the SQL_ID, SQL_EXEC_ID and SQL_EXEC_START of the monitored SQL statement (V$SQL_MONITOR can be used for this) and run the following in SQL*Plus.
SQL> @hybrid_query_report.sql sql_id=<SQL_ID> sql_exec_id=<SQL_EXEC_ID> sql_exec_start=<SQL_EXEC_START>
Notes:
SQL_EXEC_START must be provided in
YYYYMMDD_HH24MISSformatThis method can also be used to generate reports for non-hybrid SQL statements if required
Report on the Latest Monitored Hybrid SQL for the Instance
Run the following in SQL*Plus.
SQL> @hybrid_query_report.sql get=LATEST
Notes:
Only monitored SQL statements containing Gluent Data Platform hybrid objects will be considered
Report on the Longest-Running Monitored Hybrid SQL for the Instance
Run the following in SQL*Plus.
SQL> @hybrid_query_report.sql get=LONGEST
Notes:
Only the last 24 hours of monitored SQL statements containing Gluent Data Platform hybrid objects will be considered
Naming a Hybrid Query Report
By default, reports are generated with a fixed naming format of hybrid_query_report_[SQL_ID]_[SQL_EXEC_ID]_[SQL_EXEC_START].html and are saved in the current working directory.
To change the location and/or name of the saved report, either one or both of the following options can be added to any of the execution methods described above:
report_path=<REPORT_PATH> report_name=<REPORT_NAME>
For example, to change the path and name of the latest monitored hybrid SQL statement for a SQL_ID:
SQL> @hybrid_query_report.sql sid=<SQL_ID> report_path=<REPORT_PATH> report_name=<REPORT_NAME>
Notes:
Report paths must be alphanumeric but can include
_and-as word separators and/or\as directory separators (as applicable). Root path/cannot be used but Windows drive paths (e.g.C:\\Temp) can be usedReport names must be alphanumeric but can include
_and-as word separators and.htmlas extension (this will be added if excluded)
Viewing a Hybrid Query Report
The hybrid_query_report.sql script outputs the name of the generated .html report file. To view the report, transfer the generated file to a host with browser access and open it.
Generating a Hybrid Query Report in Oracle SQL Developer
Gluent Data Platform includes a Shared Report for Oracle SQL Developer that enables users to browse all monitored SQL statements involving hybrid objects and generate reports for those of interest with Hybrid Query Report. This Shared Report is known as the Hybrid Query Report Browser.
Installing the Hybrid Query Report Browser
The Hybrid Query Report Browser is available as a Shared Report for Oracle SQL Developer 4.x (and later) on macOS and Microsoft Windows and can be found in the $OFFLOAD_HOME/sql/hybrid_query_report directory of the Gluent Data Platform installation. Using the right version of the Browser for your OS means that the reports generated with Hybrid Query Report will open automatically upon generation.
To add the Browser to Oracle SQL Developer perform the following steps:
Transfer the relevant XML file to a location on your PC/Mac
macOS: HybridQueryReportBrowser.xml
Microsoft Windows: HybridQueryReportBrowserMSWin.xml
The file will be re-loaded on every startup of Oracle SQL Developer, so it is recommended that the file is saved in the same location as other user files for Oracle SQL Developer (e.g.
~/.sqldeveloper/on macOS)
In Oracle SQL Developer:
Microsoft Windows: Tools → Preferences or macOS: Oracle SQL Developer → Preferences
Navigate to Database → User Defined Extensions
Click Add Row
Enter Type = REPORT
Enter Location = [location of XML file], choose REPORT and under Location, find and select the XML file
macOS: HybridQueryReportBrowser.xml
Microsoft Windows: HybridQueryReportBrowserMSWin.xml
Click OK
Restart Oracle SQL Developer
The Browser will be installed and available under the Reports → Shared Reports tree (if the Reports tree is not visible it can be opened with View → Reports)
Using the Hybrid Query Report Browser
To use the Hybrid Query Report Browser, perform the following steps:
In the Reports tree, click Shared Reports → Hybrid Query Report Browser
Choose a Connection
From the opened report, select a monitored SQL statement from the master pane (top pane)
In the child pane (bottom pane), click on one of the three named tabs to:
View the Monitored SQL Text for the selected SQL statement
View metadata for the Hybrid Objects involved in the SQL statement
Generate a Hybrid Query Report for the SQL statement:
Select the Hybrid Query Report tab
At the first pop-up prompt, enter a valid base directory path to save the report file output (this is a directory path only - do not include a report file name)
At the second pop-up prompt, enter an optional file name to save the report file output or hit enter to save to a default name (see Naming a Hybrid Query Report for more information on defaults and valid naming formats)
The report should open automatically in the default web browser. If not, navigate to the directory you entered above and open the report manually. The name of the report will be displayed on the Oracle SQL Developer script output pane.
Tip
To regenerate any of the reports in the Hybrid Query Report Browser, click the appropriate Refresh icon for the master or detail pane of interest.
Interpreting a Hybrid Query Report
Data Daemon Web Interface
Data Daemon includes a web interface that can be used to browse both active and completed/terminated hybrid query calls. The interface can be viewed with any web browser and is available by default on port 50052 of the server(s) on which Data Daemon is running. For more information on configuring Data Daemon (for example, to change the port or to add authentication), see Configuring Data Daemon Web Interface.
The web interface shows details for both in-flight calls and the last 100 completed calls to the backend on the landing page (examples shown below are from Google BigQuery).
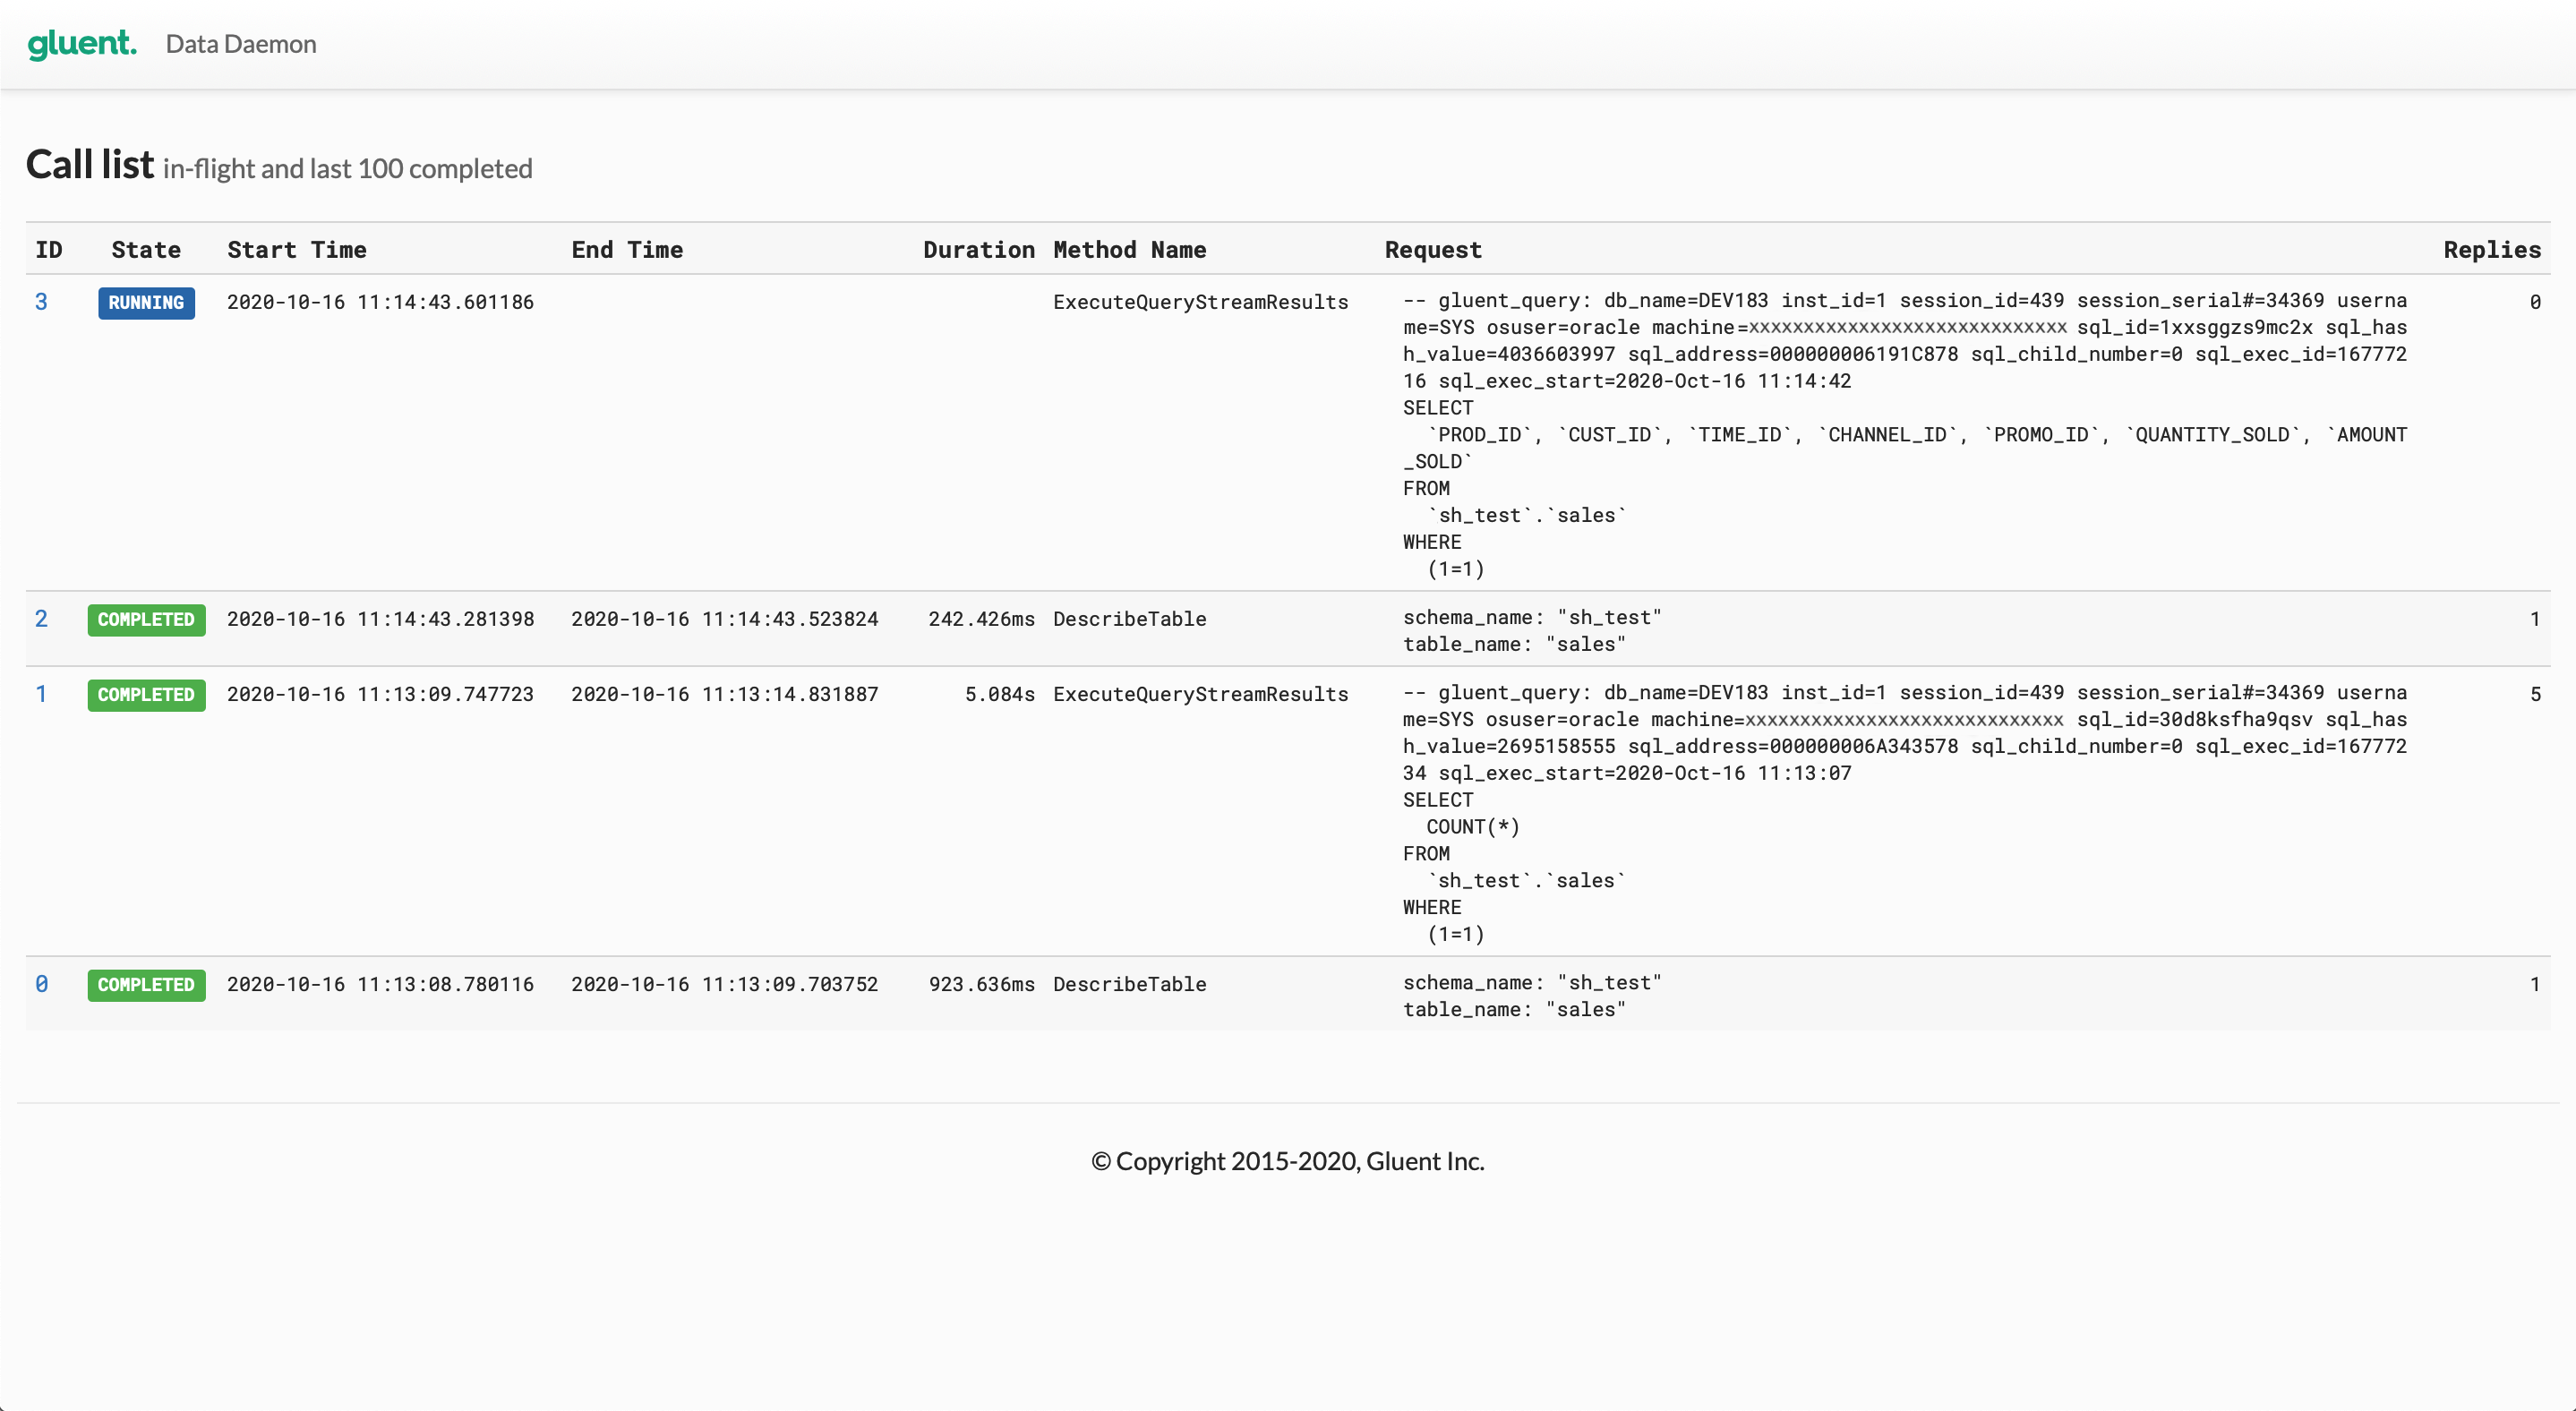
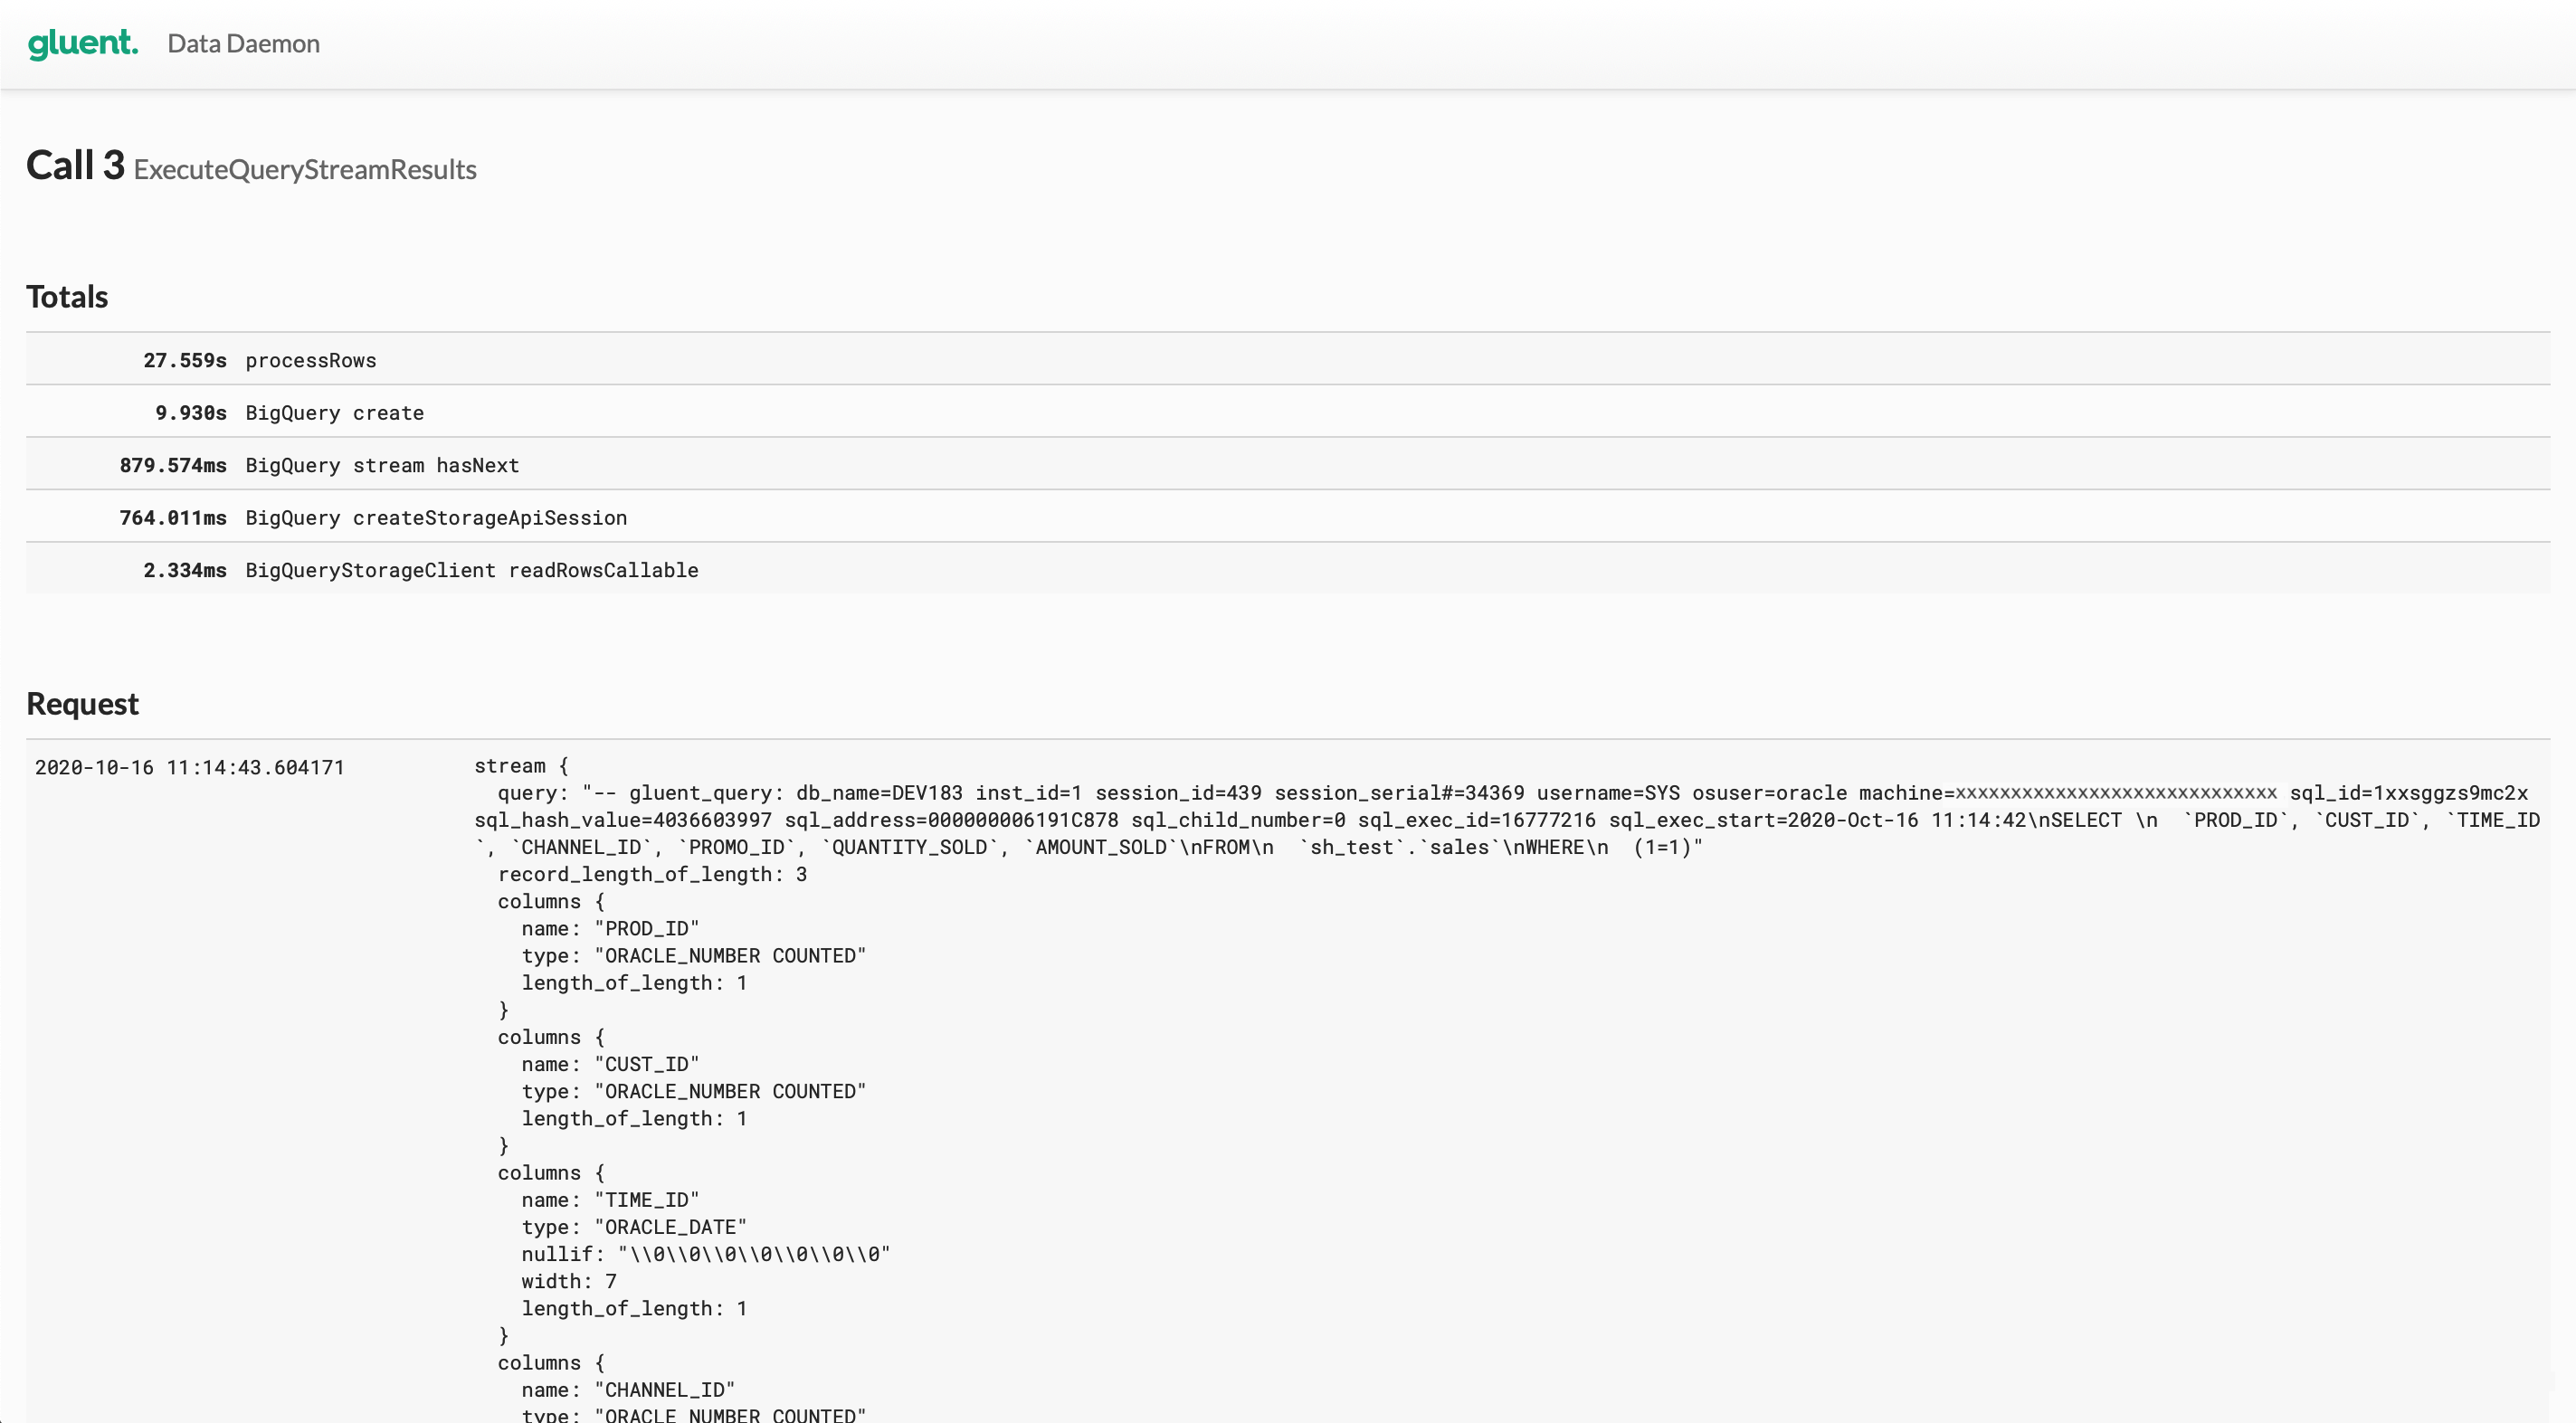
Clicking on the link in the ID column drills down into the detail for the selected call.
Note
Data Daemon retains details of only the last 100 calls. Clicking on the ID link for a call that has aged out will return an expected error.
Gluent Offload Engine Utilities
Gluent Offload Engine includes a number of utilities in addition to those with their own dedicated guide (i.e. Offload, Present, Incremental Update). The following utilities are described below:
Schema Sync
Schema Sync automates schema evolution by detecting and applying source schema changes to offloaded tables. Schema Sync can be scheduled or used interactively to search one or more schemas for data model changes to offloaded tables and either automatically apply these changes to the corresponding offloaded backend table or simply record the relevant SQL and present commands to a file to apply the changes later.
Schema Sync is invoked using the schema_sync binary located in the $OFFLOAD_HOME/bin directory.
Supported Operations
Schema Sync only detects changes to RDBMS tables that have been offloaded and propagates the changes to the corresponding tables in the backend system. Changes to presented tables can be propagated to the RDBMS with Present.
Schema Sync currently supports the addition of new columns only. For other types of schema changes, such as renaming columns, changing column sizes, dropping columns, manual schema evolution is required (see Schema Evolution in the Present guide for details). Manual schema evolution is also required when a new RDBMS column has a default value. In such cases, Schema Sync can be used to propagate the new column, but will not back-populate it after adding it to the backend table.
Selecting Tables
Use the --include option to select tables to examine for change detection and evolution. This option accepts a CSV list of schemas, schema.tables or tables, and wildcards are supported. If this option is not supplied, then Schema Sync will examine all offloaded tables in the database for changes.
Recording Changes
The --command-file option can be used to record the commands that have been applied (if the --execute option has been used) or will be applied manually (i.e. if the --execute option has not been used). All commands are provided in the sequence they have been (or need to be) applied.
Aggregation Hybrid Objects
If the table was originally offloaded using the --no-create-aggregations option, the --no-create-aggregations option must be used with Schema Sync to prevent the aggregation hybrid objects from being created.
Example 1: Synchronize Column Additions to Several Tables in a Schema
If several tables have had column additions for a schema, the --include can be used to specify a schema, and Schema Sync will process only those tables with column additions. The following example restricts Schema Sync operations to the SH schema:
$ $OFFLOAD_HOME/bin/schema_sync --include=SH -x
Offload Status Report
Gluent Data Platform includes the Offload Status Report utility to report the state and progress of offloaded tables. It is invoked using the offload_status_report binary located in the $OFFLOAD_HOME/bin directory.
Offload Status Report provides a database, schema and table level breakdown of data into retained, reclaimable and offloaded categories. It can be used in summary or detail modes, and can be run against a schema, table or database. If the Offload Status Report is run at detail level, additional information is provided for each table.
Offload Status Report Scope
A report can be generated with Offload Status Report at any of the following levels:
Database: In the absence of the
--schemaand--tableoptions the report will be database-wide (default)Schema: If only the
--schemaoption is specified, the report will include all tables for that schemaTable: Typically both
--schemaand--tableoptions are listed for a specific table. Although--tablecan be used to get a table with the same name across schemas
Offload Status Report Output Level
By default, Offload Status Report generates reports at summary level. The level of detail can be increased with the --output-level option set to detail.
Summary-level reports include the following information:
Report Options: Options specified when running the report
Database Environment: RDBMS and backend database details
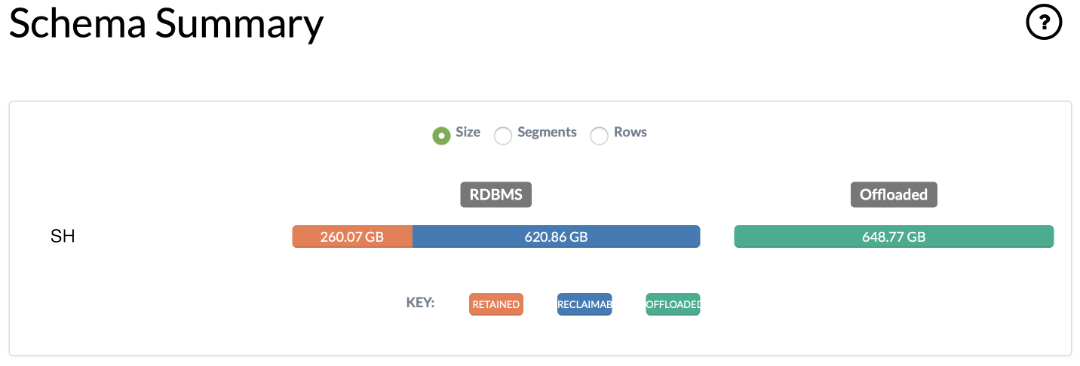
Schema Summary: Statistics for retained, reclaimable and offloaded data summarized by schema
Table Summary: Statistics for retained, reclaimable and offloaded data summarized by table
Detail-level reports include the following additional information per table:
Offload Summary Statistics: Statistics for retained, reclaimable and offloaded data
Offload Table Details: Base RDBMS and backend hybrid objects
Offload Parameters: Offload metadata
Dependent Hybrid Objects: Supporting hybrid objects created for optimizations such as Advanced Aggregation Pushdown or Join Pushdown
Offload Status Report Output Format
By default, Offload Status Report will generate a report as a text file. The --output-format option can be used with one of the following values as required: text, html, csv, json. Note that the csv option can be further configured with the --csv-delimiter and --csv-enclosure options.
Example 3: Offload Status Report in HTML Format
The following example demonstrates how to generate a database-wide, summary HTML report with Offload Status Report and provides some samples from the report itself:
$ . $OFFLOAD_HOME/conf/offload.env

$ $OFFLOAD_HOME/bin/offload_status_report --output-format=html
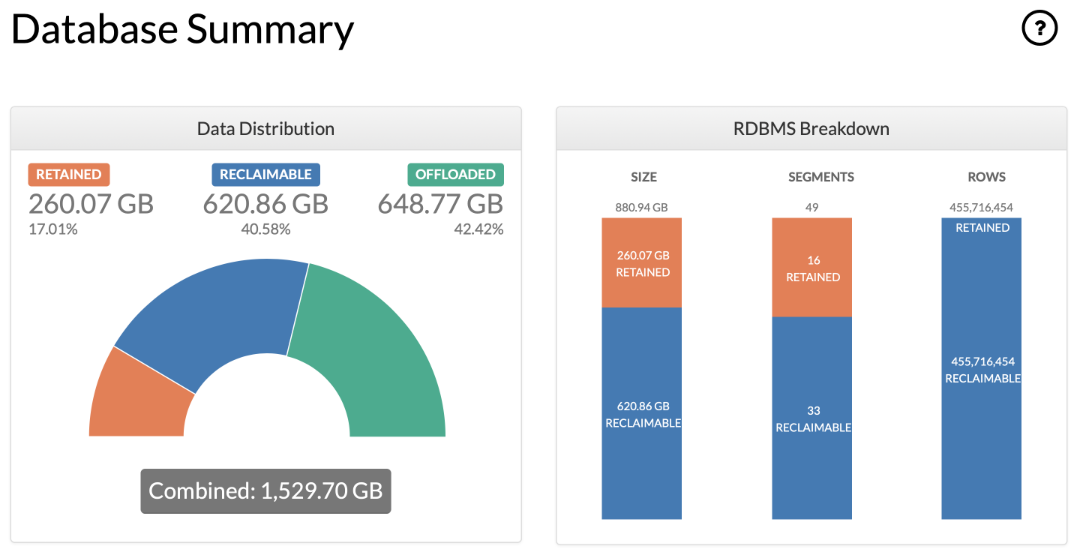
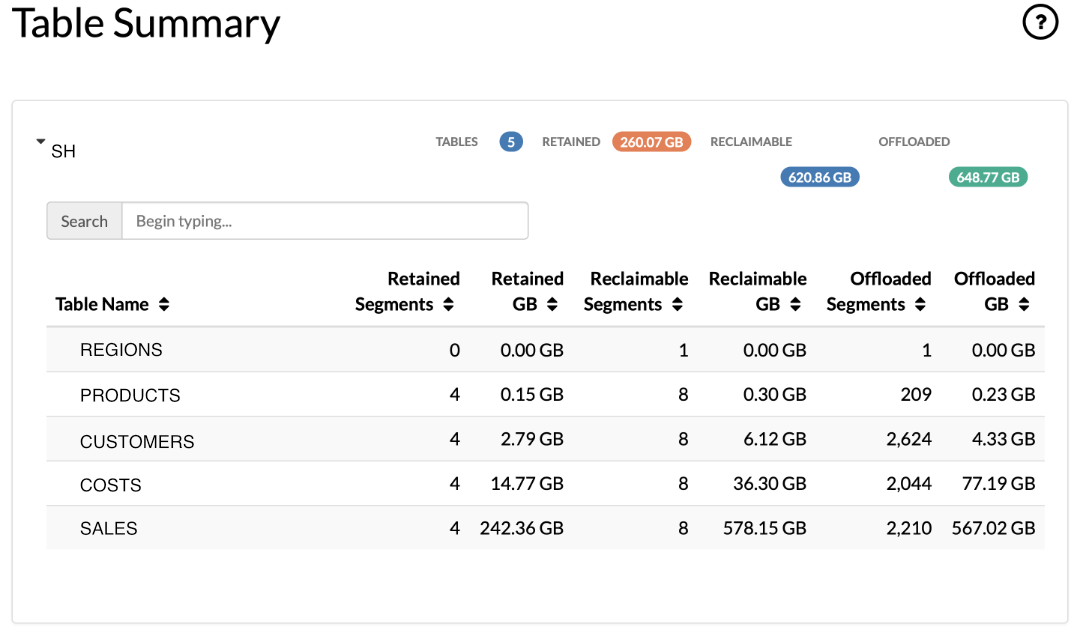
Tip
The HTML report includes definitions of the various reporting classifications (for example, the “reclaimable”, “retained” and “offloaded” categories of statistics). These can be viewed by clicking on the ? icons in each section of the report.
Diagnose
Diagnose collects diagnostic information to assist with troubleshooting issues in conjunction with Gluent Support. It is invoked using the $OFFLOAD_HOME/diagnose binary.
Diagnose creates a compressed archive of files in the --output-location directory (defaults to the $OFFLOAD_HOME/log directory). Individual files are removed after being archived. This behavior can be overridden with the --retain-created-files option.
As with other Gluent Offload Engine components, by default the tool runs in verification mode. To execute the diagnostic routines, include the -x option.
Diagnose can be used to gather a range of diagnostic information, described in the following sections:
Collect Object Metadata
Use the --table option to collect metadata (such as DDL and statistics) from both the RDBMS and backend for a specified table and its dependent Gluent Data Platform objects.
Collect Logs
Diagnose searches for files contained in the --log-location directory (defaults to the $OFFLOAD_HOME/log directory). The search range can be:
The last <n> days or hours (
--include-logs-last)From a specified date and optional time (
--include-logs-from)To a specified date and optional time (
--include-logs-to)Between a specified date and optional time range (by combining
--include-logs-fromand--include-logs-to)
Collect Details on Backend Components
Diagnose can retrieve the following information from the backend system:
Query engine logs (
--include-backend-logs)Query engine configuration (
--include-backend-config)Query execution logs (
--include-query-logs)
For Cloudera Data Hub and Cloudera Data Platform Private Cloud, Diagnose will attempt to connect with the Impala Daemon HTTP Server on port 25000. The --impalad-http-port option can be used to override this default for servers listening on a different port.
Query engine logs, Query engine configuration and Query execution logs are not available for Cloudera Data Platform Public Cloud.
For Google BigQuery and Snowflake, Diagnose can retrieve specific query logs using the --include-query-logs option. For BigQuery, the query’s Job ID must be provided and for Snowflake, the session ID and query ID must be provided, separated by a :. Query engine logs and the Query engine configuration are not available for BigQuery or Snowflake.
By default, Diagnose will retrieve the last 10MB of each backend log it retrieves. This value can be overridden using the --backend-log-size-limit option.
Collect Details on Gluent Data Platform Components
Diagnose can collect details for running processes related to Gluent Data Platform components (use the --include-processes option). It can also collect permissions of files and directories related to Gluent Data Platform operation (add the --include-permissions option).
Diagnose Defaults
All Diagnose options have a default value and diagnose can be executed with only the -x option if required (see Example 4 below). In its basic mode, the following diagnostic routines are included (when applicable):
Last 8 hours of files in the log location
Details for running Gluent Data Platform-related permissions
Details for running Gluent Data Platform-related processes
Query engine logs
Query engine configuration
Example 4: Simple Diagnose Command
Diagnose can be run with default settings as follows:
$ $OFFLOAD_HOME/bin/diagnose -x
Example 5: Gather Process Details and Logs for the Last 2 Hours
The following example limits the collection of logs to the previous 2 hours and includes Gluent Data Platform processes:
$ $OFFLOAD_HOME/bin/diagnose --include-logs-last=2h --include-processes -x
Password Tool
Password Tool is used to encrypt passwords held in Gluent Data Platform configuration files. It is invoked using the pass_tool binary located in the $OFFLOAD_HOME/bin directory and performs two actions:
Create a Password Key File
To encrypt passwords in the configuration file, a password key file must first be populated with an encryption key. When creating the key file, the user is prompted to provide a passphrase. The passphrase is case-sensitive and is not stored by pass_tool.
Example 6: Using Password Tool to Create a Password Key File
The following example demonstrates how to create a password key file using the --keygen and --keyfile options.
$ $OFFLOAD_HOME/bin/pass_tool --keygen --keyfile=$OFFLOAD_HOME/conf/gluent_secret.key
Enter passphrase to generate key:
Verifying - Enter passphrase to generate key:
Created key file /u01/app/gluent/offload/conf/gluent_secret.key
Note
The password key file is protected by operating system file permissions. Care should be taken to protect this file and its permissions. It is recommended that the password key file and Offload configuration file are not backed up to the same backup media.
Create an Encrypted Version of a Password
Password Tool is used to generate an encrypted version of a password for use in a Gluent Data Platform configuration file. Before encrypting a password, a password key file must first be created as shown in Example 6 above. Password Tool prompts for a clear-text, case-sensitive password as input and produces an encrypted password string as output.
Example 7: Using Password Tool to Generate Encrypted Password
The following example demonstrates how to generate an encrypted version of a password using the --encrypt option of pass_tool:
$ $OFFLOAD_HOME/bin/pass_tool --encrypt --keyfile=$OFFLOAD_HOME/conf/gluent_secret.key
Enter password to be encrypted:
Verifying - Enter password to be encrypted:
Encrypted password: Xzc62DK/EfdklSa5UxY0TA==
Use the encrypted password in offload.env
It is also required to add the following to offload.env:
export PASSWORD_KEY_FILE=/u01/app/gluent/offload/conf/gluent_secret.key
The corresponding value in the configuration file should be replaced with the encrypted string and the PASSWORD_KEY_FILE should be added (if not already present).
Example 8: Configuration File Before and After Encryption
The following example demonstrates the relevant entries in the Gluent Data Platform configuration file before and after encryption.
Initial settings before encryption:
export HIVE_SERVER_PASS='A_s3cr3t'
export ORA_APP_PASS='An0th3r_s3cr3t'
export ORA_ADM_PASS='M0r3_s3cr3ts'
Configuration settings after encryption:
export HIVE_SERVER_PASS='nw5tB2msQmQxliTN9xCokQ=='
export ORA_APP_PASS='VeeJ9r8MYucEQssqz/IsNw=='
export ORA_ADM_PASS='dC+YZpwK4ssHMOw3rcB73Q=='
export PASSWORD_KEY_FILE=/u01/app/gluent/offload/conf/gluent_secret.key
Note
Combinations of encrypted and unencrypted passwords are not supported; if PASSWORD_KEY_FILE is specified then all password values in the configuration file must be encrypted strings.
Validate
Validate is a standalone tool, independent of Offload, that compares offloaded data with its RDBMS source table. Any data to be validated for correctness must reside in both the backend system and the source RDBMS table (data that is dropped from the RDBMS after offloading cannot be validated). A common use-case for Validate is to perform a final data validation or reconciliation before removing offloaded data from the RDBMS.
Tip
Smart Connector is not used for the validation meaning the tool can be invoked from an edge node if Gluent Data Platform has been installed there.
Example 9: Validate an Offloaded Table
Validate is invoked using the agg-validate binary located in the $OFFLOAD_HOME/bin directory. By default, Validate will verify that the minimum value, maximum value, and count for each column matches in both the RDBMS and backend table, as demonstrated below.
$ $OFFLOAD_HOME/bin/agg_validate -t SH.SALES -x

Validate (agg_validate) v4.1.0 (2490e79)
Log file: /u01/app/gluent/offload/log/agg_validate_SH.SALES_2021-02-04T13:53:34.967542.log

Validating table: SH.SALES
[OK]
Done
Example 10: Validate Columns for a Set of Dimensions
Validate can also provide checksum validation for a subset of columns, allowing dimension columns, measure columns, and aggregated functions to be specified. In the following example, the SH.SALES table is validated by comparing the sum, minimum value, and maximum value of the UNIT_COST and UNIT_PRICE columns for each PROD_ID.
$ $OFFLOAD_HOME/bin/agg_validate -t SH.SALES --selects=QUANTITY_SOLD,AMOUNT_SOLD --group-bys=PROD_ID --aggregate-functions=SUM,MIN,MAX -x

Validate (agg_validate) v4.1.0 (2490e79)
Log file: /u01/app/gluent/offload/log/agg_validate_SH.SALES_2021-02-04T13:55:35.974115.log

Validating table: SH.SALES
[OK]
Done
Result Cache Manager
For certain configurations and backend environments, Data Daemon creates Result Cache files to temporarily store hybrid query results prior to streaming the data to Smart Connector and the Oracle database. Result Cache files are automatically managed by Data Daemon, but under some circumstances, it is possible that some files might be retained beyond hybrid query execution (for example, when an option to retain Result Cache files for diagnostic purposes is set, or if a hybrid query terminates for any reason). In such cases, Gluent Data Platform includes the Result Cache Manager to remove redundant Result Cache files. Result Cache Manager is invoked using the rcpurge binary located in the $OFFLOAD_HOME/bin directory and can be executed as follows.
Example 11: Using Result Cache Manager
$ $OFFLOAD_HOME/bin/rcpurge

Result Cache Manager (rcpurge) v4.1.0 (2490e79)
Log file: /u01/app/gluent/offload/log/rcpurge_2021-02-04T13:56:59.564420.log

Smart Connector Result Cache table retention is set to 24 hours

Found Smart Connector Result Cache table: sh_load.gl_rc_3ugr730xauq90_11_20210119_124800_16777247_1_42_42068
sh_load.gl_rc_3ugr730xauq90_11_20210119_124800_16777247_1_42_42068 is 385 hours old
Dropping sh_load.gl_rc_3ugr730xauq90_11_20210119_124800_16777247_1_42_42068

Found Smart Connector Result Cache table: sh_load.gl_rc_3ugr730xauq90_11_20210119_124803_16777248_1_42_42068
sh_load.gl_rc_3ugr730xauq90_11_20210119_124803_16777248_1_42_42068 is 385 hours old
Dropping sh_load.gl_rc_3ugr730xauq90_11_20210119_124803_16777248_1_42_42068
Log Manager
All Gluent Data Platform components create log files in the $OFFLOAD_HOME/log directory. Gluent Data Platform includes the Log Manager tool to provide housekeeping for log files. Log Manager moves log files from $OFFLOAD_HOME/log to $OFFLOAD_HOME/log/archive/<YYYY.MM.DD>. By default, files are moved 60 minutes after last modification. This can be overridden by setting the LOG_MV_MINS environment parameter before invoking the tool.
Example 12: Scheduling Log Manager in cron
Log Manager is invoked using the logmgr binary located in the $OFFLOAD_HOME/bin directory. The execution schedule and configuration depends on environment requirements, but the simplest option is to schedule it in cron as follows.
0 * * * * . /u01/app/gluent/offload/conf/offload.env && $OFFLOAD_HOME/bin/logmgr